Accelerating EV Infrastructure for a Sustainable Future
The electrification of transportation, often hailed as the key solution in the fight against climate change, holds immense promise. With their potential to drastically reduce CO2 emissions, electric vehicles offer an opportunity for a greener, more sustainable future. However, the true efficacy of this transition hinges on the availability of energy from CO2-free sources.
In industrialized nations like Germany, the shift towards renewable electricity production is gaining momentum at an unprecedented pace. Technological advancements and economies of scale have significantly lowered the Levelized Cost of Electricity, making renewable energy cheaper. This shift not only substitutes CO2-emitting technologies but also lays the groundwork for decarbonizing mobility and society.
Yet, the success of this transition depends on more than just technological advancements. The existing infrastructure must be expanded and optimized to support a fully electrified car fleet. Fortunately, the groundwork for this infrastructure exists today, allowing for a gradual rollout that aligns with the adoption of EVs over the coming years.
To ensure widespread societal acceptance and enthusiasm for EVs, a synchronized approach is imperative. This includes a combination of normative, technical, political, and social measures that reinforce one another. Governments, as the key enablers, play a crucial role in providing the necessary legal framework, subsidies, and incentives to accelerate the transition, instilling confidence in the process.
Key to this transition is the ramping up of charging infrastructure to match or exceed the convenience of traditional fuel stations. This entails increasing the number of charging points, enhancing transmission capacity, and expanding CO2-free electricity production. Smart Grid technology will be vital in optimizing charging patterns, utilizing surplus renewable energy, and preventing grid overloads.
Moreover, accessibility, affordability, and convenience make (or have to make) EVs more attractive than fossil fuel vehicles. By addressing these factors, along with continued advancements in technology and infrastructure, a fully electrified car fleet in Germany by 2040, if not earlier, becomes an achievable reality as in the other EU countries which is a goal to be achieved by 2050.
As we look towards a future powered by clean energy and sustainable transportation, the collective effort of governments, industries, and individuals is not just important, but essential. By embracing the energy transition, electric mobility might pave the way for a cleaner, healthier planet for generations to come, empowering each individual in the process.
Col. Thierry SEGARD, Deputy Director of the NATO ENSEC COE.
Why does electrifying cars reduce carbon-dioxide emissions?
Electrifying mobility is considered one of the most important measures to combat the heating of the Earth’s atmosphere. In this view, electricity production must originate from carbon-dioxide-free (CO2-free) power plants to substitute diesel and petrol.
Several CO2-free electricity production technologies are available, each holding the promise of a greener future. One such technology is nuclear power, which, while not renewable due to the finite nature of Uranium fuel, is experiencing a revival and is seen as a potent future technology. However, the real potential lies in the installation of wind turbines, photovoltaics (PV), concentrating solar power plants, deep geothermal plants, and hydro or wave power. These can achieve carbon-free large-scale renewable power production, offering a beacon of hope in our fight against climate change.
In the process of decarbonizing power production, a significant milestone has been reached. The levelized costs of electricity (LOCE) of renewable plants have come down immensely, making them a more economically viable option. Since 2020, the costs of new renewable plants have been lower than those of new fossil or nuclear plants.[1] This reassuring trend is leading to a constant rise in the share of current electricity produced by renewable and nuclear plants. It seems only a matter of time until most of the electricity is produced by carbon-free plants – at least in developed countries.[2]
The next step in the global decarbonization effort is mobility, especially cars and trucks. Their expected life cycle is low compared to industrial plants and heating systems; therefore, CO2 reduction effects are quickly achievable. However, this transition is not without its challenges. Industrialized countries have started transitioning to electric vehicles (EVs), and the complete exchange of combustion engine cars with electrically powered ones is the goal of many governments until 2050. This ambitious goal necessitates a manifold increase in CO2-free power production, transmission, and distribution. The urgency of this task is underscored by the potential strain it could place on the existing infrastructure, as described in the context of a German office after an explanation of charging technologies.
Battery charging in electric cars
EVs are equipped with an electric motor, which can be supplied with power in several ways. Fully battery electric cars (BEV) store electricity in a battery charged from the power grid. Plug-in hybrid vehicles (PHEV) have a battery, a fossil fuel tank, and an electric and combustion engine. The electric engine is used as long as the battery is powered. After that, the combustion engine takes over. The electricity is taken from the power grid, while the fossil fuel is taken from the filling station. These two versions are currently the most common in EVs. The electricity for the electric engine may also be supplied by a fuel cell running on hydrogen (FCEV). Infrastructure for hydrogen supply is scarce in most countries and is separate from the power grid. For this reason, FCEV will not be discussed further.
Batteries work on direct current (DC), while the power grid for the end customer works on alternate current (AC). Therefore, a transformation from AC to DC is necessary, and a transformer is installed in the BEVs and PHEVs (Figure 1).
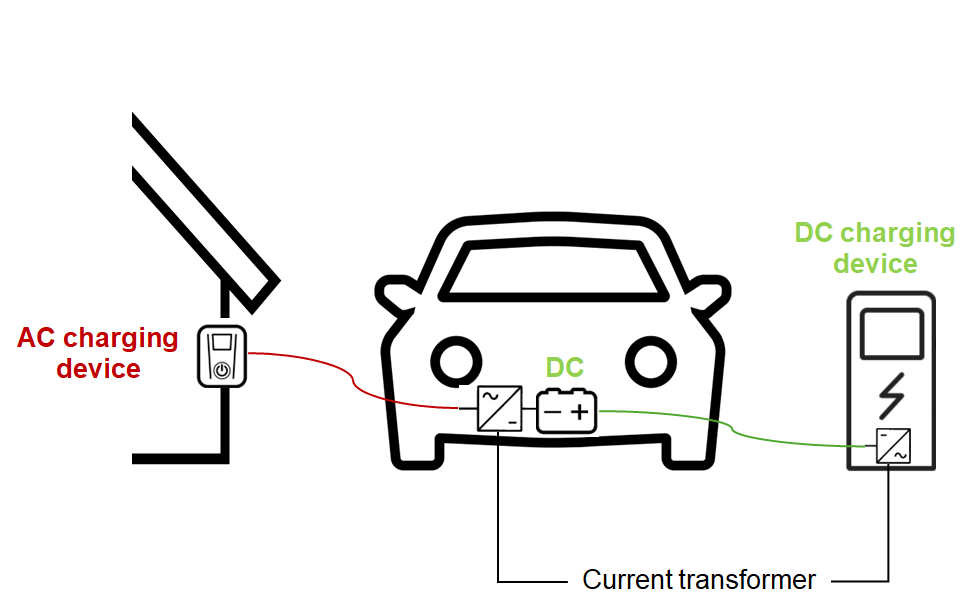
Figure 1: Charging technologies for Electric vehicles. Red = AC appliances. Green = DC appliances.
In the case of AC charging, the transformer is activated. Transformers have a car model-specific maximum charge power, which cannot be exceeded even if the charger itself is able to deliver higher charges. AC charging can be done by a conventional plug (max. 2.6 kW) or a wall box (3.7 – 22 kW available; established standard is 11 kW). Charging via a traditional plug takes longer than with a wall box and is only recommended when a high-quality plug socket is installed (Table 1).
Table 1: KPIs of standard plug for EVs in the European Union[3] and their net material costs in 2024 in EUR. KPI = key performance indicator. AC = Alternate current. DC = Direct current. Net cost of material: Material of the charging facility only, without wiring, installation, etc.
| AC | AC | DC | HPC | |
| Power | Alternate Current (AC) | Alternate Current (AC) | Direct Current (DC) | Direct Current (DC) |
| Typical location | At Home | Private wall box | Public charging station | Public charging station |
| Typical output | 2.6 kW | 3.7 – 22 kW Established standard 11 kW | 50 – 150 kW | 150 – 350 kW |
| Plug type | Schuko (Type F) | Type 2 | CCS | CCS |
| Net cost of material 2024 | < 20 € | 150 – 1000 € | Ca. 30.000 € | Ca. 40.000 € |
DC charging is quicker than AC charging because the transformers used in the charging columns are more potent than the ones installed in cars. As with AC charging, a car model-specific maximum charge power cannot be exceeded. Standard DC chargers range from 50 – 150 kW and are primarily installed in public places. High-power DC chargers work up to 350 kW. They are mostly installed at fossil fuel filling stations on motorways (Table 1).
Wall boxes and column chargers exchange information with the car about the kind of electricity to be used (AC, DC), the allowed charge power, the battery’s charging status, etc. Manufacturer-specific plugs are standard in older models. Newer models are generally equipped with CCS standard plugs, which can be used for AC and DC chargers (Table 1).
Batteries are the most expensive part of EVs and PHEVs. High costs reflect the fact that power is difficult to store. Electrical grids run on the presumption that electricity production and consumption must always be synchronized. If the synchronization fails, whole regions may be affected by load shedding – the deliberate shutdown of the power supply.[4]
Therefore, it is crucial to fit all parts of the power grid to cope with the increased electricity demand caused by the electrification of mobility. The most critical grid components are easily visible in the landscape and municipalities, securing a reliable and robust power supply.
Supplying electricity – the power grid
Electricity is supplied to the customer in a full-service contract. It is available on time in the quantity needed. This seamless supply is taken for granted, but the many parts of the power grid need to work frictionlessly (Figure 2).
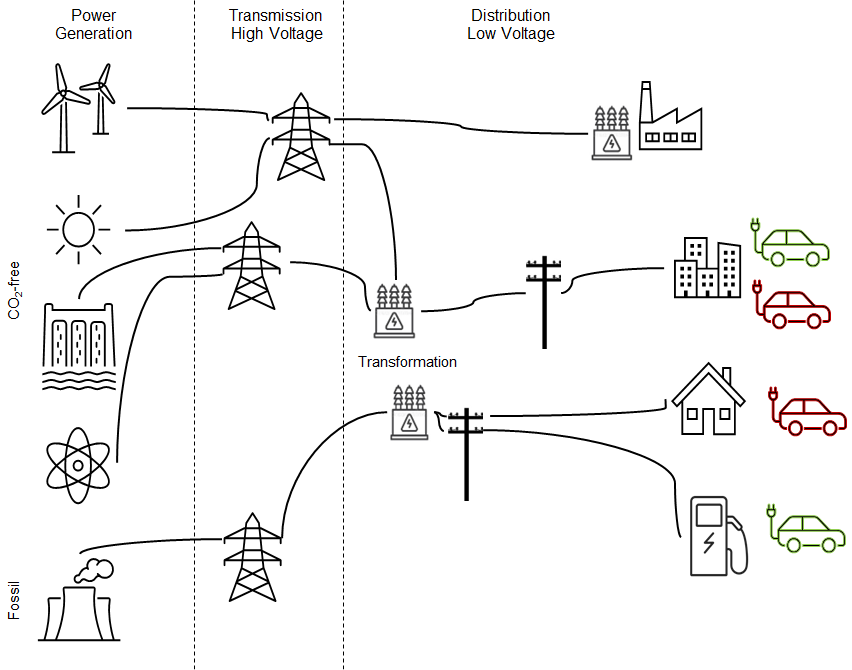
Figure 2: Grid infrastructure for EV loading. Red = AC appliances. Green = DC appliances.
Power generation
The first part of the electrical grid is power generation plants. Before the PV rooftop revolution in the 1990s, power plants were massive industrial installations, and most still are. But today, many small rooftop PV plants provide electricity to their owners and the grid.
Feed-in stations connect the power production plant to the grid. Grid connection points vary hugely in size and tasks to be fulfilled, e.g., transformation voltage and current. Off-shore wind farms, for example, may feed electricity into high voltage direct current lines (Figure 3 A), while PV rooftop plants feed directly into the distribution grid (230 Volt AC).
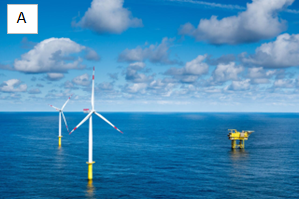

Figure 3: (A) High voltage direct current grid connection point on a platform in the North Sea in yellow on the left side. (B) Interconnector high voltage natural current station on land.[5]
Transmission
As electricity production is near and far from the consumer, long-range power transmission is needed. Power lines can be installed above and below ground and on the sea floor. AC and DC power lines are possible. Long-distance transmission is always done with medium and high-voltage lines (110 – 380 kV). High-voltage DC lines (> 380 kV) are currently built to connect places many hundred km apart, with deep-see cables included.[6]
Grid connectors fulfil tasks like grid connection points and require comparable technical equipment. They join the separate parts of the grid in terms of voltage and current (Figure 3 B).
Distribution
The distribution of the generated electricity begins with the transformation to the household 230 Volt AC electricity. After transformation, the power is directed to the so-called “house connections” to serve individual customers.
In Germany, single houses have 230 V AC and a capacity of 30 kW. High-rise apartment buildings and small and medium-sized industries also have 230 V AC. Still, the capacity of the power lines is higher, depending on their electricity and capacity demand. Extensive industrial facilities are served depending on their demand with medium or high voltage lines and up to 300 kW AC capacity.
The power line needs a suitable cross-section to transmit a given electricity capacity. The cable cross-section is defined by its material and length, among other variables. The bigger the cross-section, the higher the transmissible capacity. If the cross-section of the cable is too low for the transported capacity, it will warm up, further decreasing the conductivity and leading to an additional build-up of heat. If this vicious cycle continues, the power supply may break down, and the heat may even set the cable on fire. If the demand for a building increases due to car charging facilities, new or additional power lines may be needed.
Interconnection of the grid parts
As mentioned above, electricity supply and demand must always be synchronized. Synchronization means that production and consumption must be equal at any time without any possibility of meaningful storage capacities. High-security control centres fulfil this delicate task. They guarantee the undisrupted power supply in the synchronous electric area.[7] The most critical means to accomplish this task is to reserve capacity on every grid level.
In the German context, electricity-producing companies must provide extra production capacities for systemically relevant plants. Additionally, the German grid regulator (Bundesnetzagentur) has to approve the phasing out of a plant.[8] The uncontrollable electricity production of solar and wind plants and the fluctuating home demand of rooftop PV facilities must also be factored into the grid’s management.
Power lines are usually not used to capacity, so diverting the electricity flow in case of accidents or line maintenance is possible. Importing and exporting electricity from countries within the Continental European Synchronous Area – to which Germany belongs – is a standard procedure and stabilizes the power supply.[7]
Additional electricity capacity and energy demand for EVs in a German context
The complete electrification of the entire national car fleet is a formidable task, necessitating an extended timeline spanning many years, if not decades. Throughout this transitional phase, strategic efforts can be directed towards enhancing the electrical grid and establishing an efficient charging infrastructure. This complex process is exemplified in the following analysis of a mid-sized office building in Germany.
The German EV market is evolving. In 2023, BEV and PHEV cars comprised 3.9% of the cars in service. New registrations of BEV and PHEV were 31.4% in the same year.[9] Various governmental subsidies for purchasing or leasing BEV and PHEV cars, e-bikes, and e-cargo bikes, as well as for necessary charging infrastructure, were in place until December 2023.
As long as public charging points are scarce and private ones are not always feasible for homeowners and tenants, the fear of running out of power is prevalent among German consumers. The possibility of charging at the workplace could be a massive push in favour of EVs. Technical requirements for the additional electrical capacity and energy of a medium to large German office building providing charging power for its employees – e.g., military administration offices – are calculated based on the highest electricity power and capacity demand. At first, assumptions about working schemes and means of transportation must be specified.
Working days
Generally, a German jobholder works 220 days per year (five days a week on 52 weeks, 30 days paid leave, five days public holidays on workdays, and five days of illness).
Before the COVID-19 pandemic, work was usually performed in company spaces. During the pandemic, many workers turned their homes into offices. There is a trend towards a hybrid workweek with two days of home office time and three days of compulsory attendance in the company office. Predicting the future share of home office time takes a lot of work. Therefore, the following calculations assume five days of attendance in the company office space.
Means of Transportation and their electricity demand
The mean single mileage Germans travelled between home and their workplace in 2020 was 17 km. The primary private means of transportation was the car (68.1%), followed by bike (10.4%) and motorbike (0.7%). Public transport was used by 14.3% of workers.[10]
BEVs need between 139 and 250 kWh per km, depending on the car model (without vans and SUVs). A mean demand of 195 kWh/km is used in the model calculations.[11] The energy consumption of a fully electric bike is assumed to be 12 kWh/km,[12] while 58 kWh/km is taken for a fully electric motorbike.[13]
Maximum electricity capacity and energy demand
The power grid has to be configured to meet the maximum possible demand to avoid power outages. The following calculations were performed on this assumption.
Currently, 3.9% of Germany’s car fleet is EVs.10 We assume full electrification will be achieved by 2040, although total electrification may never be achievable. The rollout of EVs is considered linear over the coming years (2025: 15% EVs, 2030: 44% EVs, and 2035: 72% EVs, respectively).
A selection of key performance indicators (KPIs) for a standard office building with 1,000 to 5,000 employees is used to demonstrate the needed technical and financial resources. For example, in an office with 1,000 employees, usually 846 people are working at any time. Of these, 576 people travel to work by car, 88 by bike, and six by motorbike. All people travelled 34 km per day to reach the office and go back home in the evening, leading to a total of 20,125 km travelled daily. KPIs for more prominent offices are shown in Table 2. The electricity demand for the car-traveling cohort is 3,924 kWh/day, 98.8% of the total energy demand, including bikes and motorbikes (Table 3). The yearly energy demand sums up to 874,110 kWh.
Table 2: KPIs for office spaces from 1,000 to 5,000 jobholders with 100% EV usage. Column 1 refers to the number of jobholders with workplaces in the building. In contrast, column 2 shows the number of jobholders in the building on a workday considering leave, public holidays, and illness. Columns 3 to 5 refer to the number of cars, bikes, and motorbikes used for commuting, while columns 6 to 8 refer to the daily total mileage.
| Employee’s | Employees commuting by | Mileage utilizing transportation | |||||
| Total | In the building | Car | Bike | Motorbike | Car [km/day] | Bike [km/day] | Motorbike [km/day] |
| 1,000 | 846 | 576 | 88 | 6 | 20,125 | 3,073 | 207 |
| 2,000 | 1,692 | 1,152 | 176 | 12 | 40,250 | 6,147 | 414 |
| 3,000 | 2,538 | 1,729 | 264 | 18 | 60,375 | 9,220 | 621 |
| 4,000 | 3,385 | 2,305 | 352 | 24 | 80,499 | 12,294 | 827 |
| 5,000 | 4,231 | 2,881 | 440 | 30 | 100,624 | 15,367 | 1,034 |
Table 3: Energy demand of commuting employees with 100% EV usage. Column 1 refers to the number of employees with workplaces in the building. Columns 2 – 4 refer to the energy needed to commute the employees on a standard workday considering transportation. Column 5 shows the daily energy demand, while column 6 shows the yearly demand.
| Employee | Energy demand utilizing transportation | Daily total Energy demand | Yearly total net Energy demand | ||
| Car [kWh/day] | Bike [kWh/day] | Motorbike [kWh/day] | [kWh/day] | [kWh/year] | |
| 1,000 | 3,924 | 37 | 12 | 3,973 | 874,110 |
| 2,000 | 7,849 | 74 | 24 | 7,946 | 1,748,220 |
| 3,000 | 11,773 | 111 | 36 | 11,920 | 2,622,329 |
| 4,000 | 15,697 | 148 | 48 | 15,893 | 3,496,439 |
| 5,000 | 19,622 | 184 | 60 | 19,866 | 4,370,549 |
Germany has only two options to provide additional carbon-free electricity: PV and wind turbines. The government permanently shut down the last operating nuclear plant in 2023. Large-scale new hydropower plants are impossible due to a lack of geographical opportunities, and deep geothermal plants are in their infancy. A modern wind turbine (5.56 MW capacity, 2.5 m/s switching on speed, 160 m rotor diameter) in an excellent position (10.5 m/s wind speed at hub height, e.g., off-shore) can produce up to 30,000 MWh per year.[14] To make the same amount of energy with solar in a better location in southern Germany (1,800 h of sun per year equals 1,225 kWh/m² per year), 30 ha of land must be equipped with PV panels.[15] The space requirement for a wind turbine on land is approx. 1 ha.
Generating additional electricity for mobility in offshore wind parks should be possible. More critical is the capacity of the transmission and distribution grid power lines. The first must be enlarged because of the higher amounts of energy transferred, and the second must be adapted to the buildings’ higher electrical energy and capacity demand.
The additional capacity demand depends on the charging speed and the number of cars charging simultaneously. The higher the charging speed and the higher the number of cars charging simultaneously, the higher the capacity needed. Slow charging via standard household plugs is assumed for bikes and motorbikes. Only a minority of 0.1% of cars should be charged by fast DC standard chargers (150 kW charging capacity), while the majority should be set by standard wall boxes (11 kW charging capacity). In this scenario, expensive DC charging columns are rare. The total investment for a 1,000-employee building until 2040 – the year of full electrification – would be 607,880 € net of tax on material costs (without installation, Table 4).
Table 4: Charging infrastructure needed for a 1,000-employee building until 2040, the year of complete electrification. Column 2 shows the percentage of electrified cars until 2040. Column 3 shows the number of conventional plugs for charging bikes and motorbikes. Column 4 shows the absolute number of AC wall boxes under the precondition that they should serve 99.9% of cars. Column 5 shows the total number of DC charging stations under the prerequisite that they should serve 0.1% of vehicles. Column 6 contains the cumulated net of tax material investment cost for charging infrastructure without installation costs.
| Year | Percentage EV’s in Germany | Plugs for bikes and motorbikes | AC wall boxes (99.9% of cars) | DC charging stations (0.1% of vehicles) | Total investment cost |
| [%] | [€] | ||||
| 2023 | 4 | 4 | 24 | 1 | 54,080 |
| 2025 | 15 | 15 | 89 | 1 | 119,300 |
| 2030 | 44 | 41 | 251 | 1 | 281,820 |
| 2035 | 72 | 68 | 414 | 1 | 445,360 |
| 2040 | 100 | 94 | 576 | 1 | 607,880 |
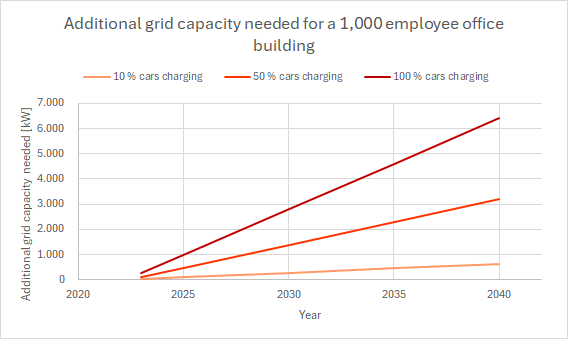
The maximum capacity demand for a 1,000-employee building must be calculated for the highest possible demand – which means that all cars, bikes, and motorcycles charge simultaneously. This assumption is unrealistic, but without technical charging management, the power lines must be equipped for this situation. An additional capacity of 6,417 kW must be supplied to the building by 2040. If only 10% of all vehicles charge simultaneously, only 642 kW additional capacity is needed by 2040.
Car charging can be stretched over 10 hours in an office workforce with standard working hours. Therefore, 10% simultaneous charging is possible based on the available time. The 7 kWh needed for a typical EV for the daily 34 km commute can be loaded with 11 kW charging equipment within 37 minutes. Technical measures can be installed to organize charging schemes.
Additional power lines are needed to supply the office building with extra capacity, and these infrastructural measures generally take time to realize. The plan of 17 years to total electrification in 2040 provides a sufficient time buffer to achieve this goal. Figure 4 shows the additional capacity needed for a 1,000-employee office from 2023 to 2040 under three simultaneous charging scenarios.
Reductions of carbon dioxide emissions
The reduction in CO2 emissions in a fully electrified car fleet in 2040 using electricity generated from oil/diesel would be approx. one ton of CO2 per day (233 t CO2 per year) since electric engines have a higher rate of efficiency (85%) than internal combustion engines (30%).[16]
The reduction in CO2 emissions in the same fully electrified car fleet in 2040 using electricity from carbon-free plants compared to diesel internal combustion cars would be approx. 3.0 t CO2 per day (660 t CO2 per year).
Effects of electrifying mobility
Only partially decarbonized electricity supply is a shared public concern. Resistance against EVs has often coalesced about it. Several advantages exist even if an EV is not charged with CO2-free energy. Electric engines are more efficient than combustion engines, and therefore, CO2 emissions are lowered. An unintended side-effect of the combustion of fossil fuels is the emission of nitric oxides (NOx) and fine particle matter (PM2.5). Both are hazardous substances accused of being responsible for thousands of premature deaths in Germany (PM2.5 = 32,300 premature deaths, NO2 = 9,500 premature deaths).[17] Finally, EVs are quieter than combustion engine cars and, therefore, decrease the background level of noise, especially in cities.
Considering the potential scenario where the demand for EVs in 2040 may not be entirely met by carbon-free electricity, the positive effects on human health and the environment imply that efforts to electrify the car fleet should be increased. Reduced toxic emissions and noise levels will improve the quality of life in public spaces.
Conclusions
The electrification of transportation is deemed pivotal in reducing CO2 emissions, which would significantly contribute to lowering global temperatures. That advantage is only possible when power from CO2-free sources is available. Even if the charging power is produced in fossil fuel plants, EVs have additional beneficial side effects on the environment, making their deployment worthwhile.
Industrialized countries – including Germany – are shifting at a remarkable pace to renewable electricity production. Technological advancements and economies of scale have substantially lowered the LOCE, making power generation from new renewable plants cheaper than from new fossil fuels and nuclear plants. Currently, CO2-free power production substitutes CO2-releasing technologies. In the future, CO2-free power capacity will be increased and increasingly used to decarbonize mobility and society.
However, the infrastructure to support a fully electrified car fleet until 2040 exists today. As the rollout of EVs will be stretched over several years, the build-up of big and smaller infrastructure projects can be pulled over the same period. This fact makes the transition possible in the first place. However, the building efforts must be synchronized with the EV’s usage to support the widespread societal acceptance of EVs.
The synchronized approach to keep public enthusiasm on the subject might include normative, technical, political, and social measures that influence and give feedback to each other. Governments are responsible for an ambitious legal framework for decarbonization goals, subsidies for adapting existing private and corporate car fleets, grid infrastructure, building codes, and mandatory charging points for new houses and offices.
Charging infrastructure must be ramped up to provide at least as close a supply network as the existing filling stations. The amount of charging points must be higher than the existing fuel dispensers, as charging is more time-consuming than filling a tank with fossil fuel. The expanded charging infrastructure requires more power lines with increased transmission capacity and increased CO2-emission-free electricity production in the mid-term. As high-speed charging will become increasingly common, a particular focus on the capacity of the electricity lines is mandatory.
Smart Grid technology will enable charging when the sun shines and the wind blows. Especially in summer, PV plants are often blocked from production due to a lack of demand or grid capacity. The same is true for wind power plants, especially in winter. The intelligent allocation and usage of these electricity production peaks will be vital to the transition to e-mobility.
Smart Grid technology is also needed to prevent blackouts in the case of simultaneous loading of too many EVs. Charging from the grid might be stretched into nighttime when general demand is low. Private rooftop PV plants equipped with battery storage can smooth the peak demand by storing power for use when needed.
For a successful transition from fossil fuel to electric mobility, the car user must know the work performed to make the transition happen. EVs must also be more accessible, cheaper, and more convenient than fossil fuel cars. If this can be achieved, a fully electrified car fleet will be possible in Germany by 2040, if not earlier.
Acknowledgments
We greatly appreciate the support of Public Affairs Officer Paulius Babilas (LTU) and Subject Matter Expert Ben Cook (UK) for excellent support during the editing process.
About the authors
Dr. Jutta Lauf is a consultant to the NATO SAS 182 Programme on Climate Change and Security. From 2020-2022, she was a Research Fellow with the Research and Lessons Learned Division at the NATO Energy Security Centre of Excellence (NATO ENSEC COE) in Vilnius, Lithuania.
Dipl. Ing. Wsewolod Rusow (DEU) is the Head of the Research, Analysis, and Lessons Learned Division at the NATO Energy Security Centre of Excellence in Vilnius, Lithuania.
References
1. International Renewable Energy Agency. 2021. “Renewable Power Generation Costs in 2020.” ISBN: 978-92-9260-348-9. Unpublished manuscript, last modified December 02, 2021. https://www.irena.org/publications/2021/Jun/Renewable-Power-Costs-in-2020.
2. Ritchie, Hannah, Pablo Rosado, and Max Roser. 2024. “Electricity Production by Source.” Accessed January 31, 2024. https://ourworldindata.org/grapher/electricity-prod-source-stacked?country=~OWID_EUR.
3. EnBW. 2023. “Was Ist Der Unterschied Zwischen AC- Und DC-Laden? I EnBW.” Accessed January 24, 2024. https://www.enbw.com/blog/elektromobilitaet/laden/grundwissen-was-ist-der-unterschied-zwischen-ac-und-dc-laden/.
4. Lauf, Jutta, and Reiner Zimmerman. 2022. “Connecting Production Facilities and Transport Infrastructure for Creating Robust and Carbon-Neutral Sector-Integrated Energy Systems.” Energy Highlights ISSN 2335-7975 (17): 21–34. https://www.enseccoe.org.
5. Siemens Energy. 2024. “Offshore Grid Access: Bringing Your Offshore Wind Assets to Operational Perfection.” News release. February 20, 2024. https://www.siemens-energy.com/global/en/home/products-services/service/grid-access-services.html.
6. TenneT TSO GmbH, Bernecker Str. 70, 95448 Bayreuth. 2020. “NordLink – TenneT (2020).” https://www.tennet.eu/our-grid/international-connections/nordlink/.
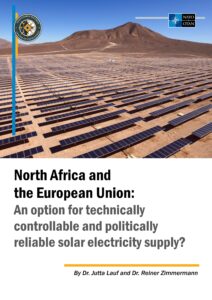
7. Lauf, Jutta, and Reiner Zimmerman. 2023. “North Africa and the European Union: An Option for Technically Controllable and Politically Reliable Solar Electricity Supply?” Energy Highlights ISSN 2335-7975 (18): 18–45. https://www.enseccoe.org/data/public/uploads/2023/01/d1_morocco-europe-20230104-for-online.pdf. Accessed March 07, 2023.
8. Gesetz Über Die Elektrizitäts- Und Gasversorgung. Bundesministerium der Justiz und für Verbraucherschutz. February 3, 2024. Accessed February 03, 2024. https://www.gesetze-im-internet.de/enwg_2005/
9. Statista. 2024. “Elektromobilität in Deutschland.” Accessed January 29, 2024. https://de.statista.com/themen/608/elektromobilitaet/#topicOverview.
10. Statistisches Bundesamt. 2022. “Berufspendler.” Accessed January 21, 2024. https://www.destatis.de/DE/Themen/Arbeit/Arbeitsmarkt/Erwerbstaetigkeit/Tabellen/pendler1.html.
11. EV Database. 2024. “Energy Consumption of Full Electric Vehicles.” Accessed January 22, 2024. https://ev-database.org/cheatsheet/energy-consumption-electric-car.
12. Evitmov, Ivan, Rosen IVANOV, Gergana STANEVA, and Georgi KADIKYANOV. 2017. “A Study on Electric Bicycle Energy Efficiency.” Transport Problems 10 (3): 131–40. https://doi.org/10.21307/tp-2015-041.
13. Kusalaphirom, Triluck, Thaned Satiennam, and Wichuda Satiennam. 2023. “Factors Influencing the Real-World Electricity Consumption of Electric Motorcycles.” Energies 16 (17): 6369. https://doi.org/10.3390/en16176369.
14. Enercon. 2024. “Windenergieanlagen Von Enercon Neues Topmodell E-175 EP5.” Accessed February 04, 2024. https://www.enercon.de/de/windanlagen/e-160-ep5.
15. Bayerisches Staatsministerium für Wirtschaft, Landesentwicklung und Energie. 2015. “Bayerischer Solaratlas.” https://www.stmwi.bayern.de.
16. Lauf, Jutta. 2020. “Replacing NATO F-34: Technologies and Economic Aspects of Using Secondary Carbon Sources for Power-to-Fuel Production.” Energy Highlights ISSN 2335-7975 (14): 30–51. https://www.enseccoe.org/en/newsroom/nato-ensec-coe-is-pround-to-present-its-new-compilation-of-studies-energy-highlights-no.-14/484.
17. European Environment Agency. 2023. Harm to Human Health from Air Pollution in Europe : Burden of Disease 2023. Kopenhagen (Denmark): Publications Office. Accessed February 11, 2024. https://www.eea.europa.eu/publications/harm-to-human-health-from-air-pollution/.
Other Publications by This Author
-

Ocean Power Generating Technologies – a Vast Renewable Energy Potential
This article explores the ocean’s vastly untapped power production potential,
-
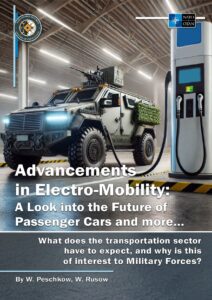
Advancements in Electro-Mobility: A Look into the Future of Passenger Cars and more…
The article proposes the concept of 'energy superiority' as a fundamental pillar
-
Unlocking Potential: Synthetic Fuels in Modern Military Operations
Synthetic fuels represent a transformative solution for modern military forces s
-
Climate change related problems to hydropower plants in the tropics and sub-tropics
This article focuses on problems emerging from climatic changes, caused primaril
-
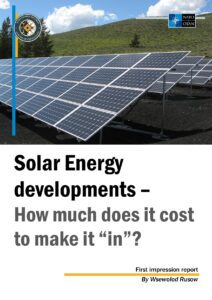
Solar Energy developments – How much does cost to make it “in”?
This is a first impression report from the combined conference and exhibition -
-
North Africa and the European Union: An option for technically controllable and politically reliable solar electricity supply?
-
Is de-carbonising the construction industry possible? An overview of advances in materials and processes
-
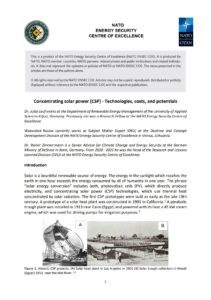
Concentrating solar power (CSP) – Technologies, costs, and potentials
-
Connecting production facilities and transport infrastructure for creating robust and carbon-neutral sector-integrated energy systems
Energy security of nations is a precondition for developing economic wealth and
-
Hurricane threats to military infrastructure in a warming world and possible adaption and mitigation strategies
With respect to global warming the armed forces differentiate between the impact